A considered approach to market research

Don't
chase it.

An opportunity deserves more than a moment's attention.

Study the seasonal window. Look for confirmation in an emerging move. Understand the evidence before deciding what comes next.

Independent research. Four distinct models. One discipline.

THE SME PERSPECTIVE01 — 03
01
SEASONALITY

Wait for
the window.

History gives a period context.
It does not promise a repeat.

02
CONTINUATION & SURGE

Wait for
the confirmation.

A developing setup is an observation.
A qualified signal is a separate event.

03

Keep the context.
Read the losses as carefully as the gains.

Patience has a process.

Window Confirmation Context

01 / Open research

Explore the thinking before the launch.
No signup needed.

A window is a question.
Start with the evidence.

Seasonality studies how a stock behaved during a recurring period. The useful question is not simply “did it rise?” It is how often, against what benchmark, and with what exceptions.

A saved seasonal research example

AAPL Reading a seasonal window

Historical research
I.

The stock

Examine the same recurring entry and exit window across the saved sample.

II.

The comparison

Compare SPY over matching dates. A stock's gain alone does not establish an edge.

III.

The exceptions

Keep losing years visible. Consistency and downside belong beside the average.
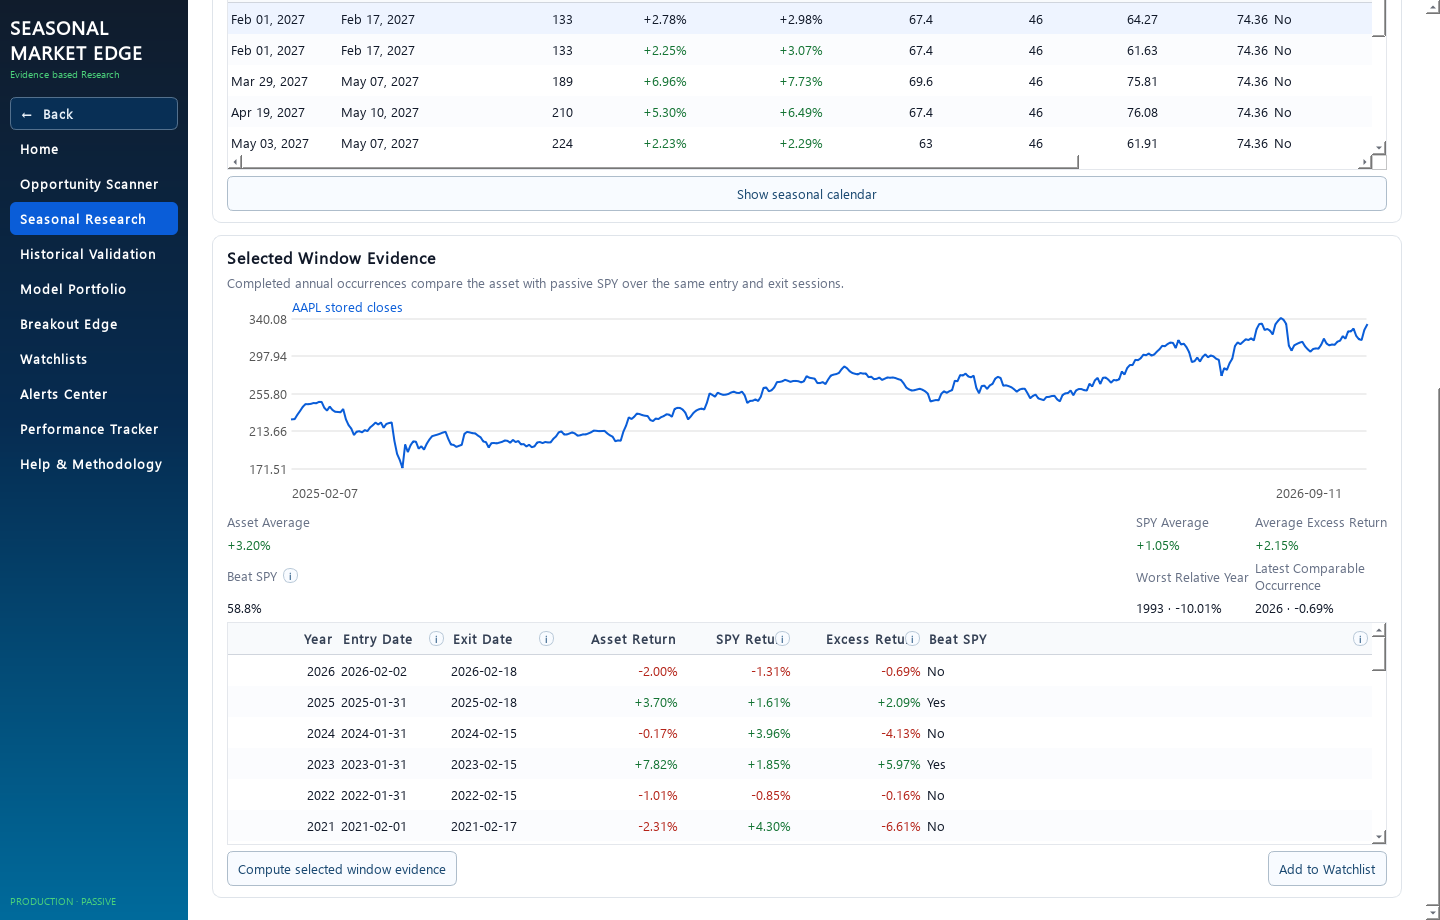
Saved AAPL Selected Window Evidence screen comparing annual stock returns with SPY over matching entry and exit sessions; losing stock years are visible.Inspect the genuine saved screen

Saved product view, 21 September 2026. AAPL annual occurrences are compared with passive SPY over matching entry and exit sessions, with losses visible. The price line above the table is stored stock prices, not portfolio performance. This is historical research, not a current recommendation.
Historical patterns can fail. A past seasonal window is research context, not a forecast or a recommendation to buy a security.

02 / Momentum research

Continuation

An established move.
A considered next step.

Wait for the confirmation.

Continuation is a selective momentum model that looks for established price moves with room to continue. The research follows the structure of the move, rather than assuming that recent strength is enough.

Price compression and volume contraction can form a developing setup. Breakout confirmation is a distinct step. A setup can change or disappear before it qualifies.

Read the research example
CONTINUATION / STRATEGY PERFORMANCE2016–2025

The whole sample.
Including the exceptions.

Historical simulation · preserved research · annual returns

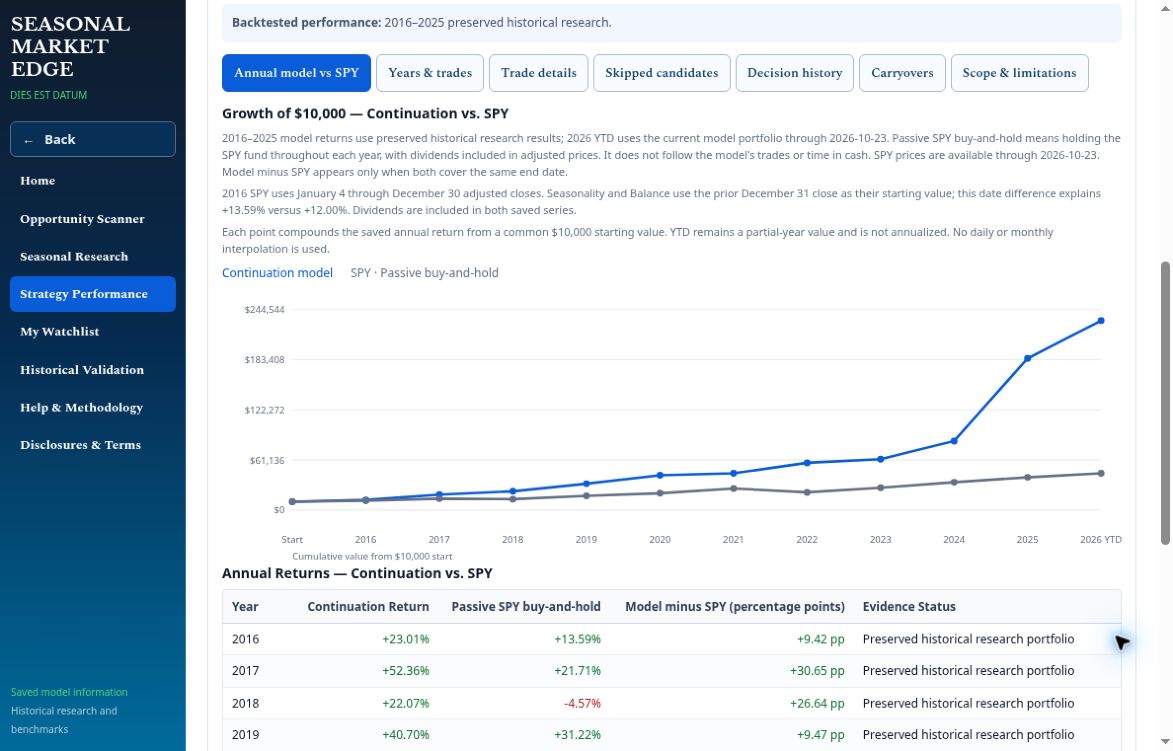
Continuation preserved historical simulation and passive SPY annual returns, 2016 through 2025, percentages.
YearModelPassive SPY¹
201623.01%13.59%
201752.36%21.71%
201822.07%−4.57%
201940.70%31.22%
202032.07%18.33%
20215.63%28.73%
202228.56%−18.18%
20237.67%26.18%
202435.50%24.89%
2025119.70%17.72%

2021 and 2023 trailed passive SPY. All ten saved years are shown; this is not an actual account record.

Read with the assumptions

4 January 2016–31 December 2025. Preserved three-slot historical research portfolio, $10,000 initial capital, fractional shares and zero transaction costs. ¹Passive SPY uses dividend-adjusted prices and stays invested, so its cash exposure differs from the model.

Sources and limits of this example

Model values use the saved 2016–2025 year-end reference, independently checked against starting and ending equity. SPY annual arithmetic was checked against the saved adjusted-close source. This is the preserved J1815 historical research portfolio, not a retrospective simulation of today's stock universe. A complete authenticated daily-equity archive and independent reconstruction of the full detector/universe history are not available. Annual arithmetic verification does not establish the correctness of the entire historical strategy. No current 2026 results are included.

03 / Breakout research
SURGE / STRATEGY PERFORMANCE2016–2025

Strength and setbacks.
Both belong here.

Expanded historical simulation · annual returns

Surge Expanded historical simulation annual returns and matched-exposure SPY close proxy, 2016 through 2025, percentages.
YearModelSPY proxy²
2016−0.77%−3.99%
20178.32%4.20%
201840.68%12.66%
20199.80%10.44%
20207.71%−1.34%
2021−29.37%3.43%
2022−11.26%−14.87%
202311.64%3.30%
2024145.32%13.70%
202519.08%3.50%

The model lost money in 2016, 2021 and 2022. The SPY proxy is not a synchronized tradable excess-return comparison.

Surge

When a base
becomes a move.

Wait for the confirmation.

Surge is a short-duration breakout model designed to identify strong moves emerging from structured price bases. The emphasis is on evidence of a breakout, rather than anticipation alone.

A detector event uses completed-session evidence. Acceptance, ranking, capacity and admission remain separate decisions. The appearance of a breakout does not mean the model bought it.

How to read the results
Read with the assumptions

4 January 2016–31 December 2025. One slot, $1,000 initial capital, fully compounded fractional units and zero explicit costs. Idealized daily-bar fills; stop first if both thresholds touch. Preserved historical rosters retain survivorship and source limitations.

²SPY is a separate account invested only during the model's exposure windows. It uses adjusted opens for entries/open exits and the same day's adjusted close as a proxy for intraday exits. It differs from the passive SPY comparison used for Continuation.

Sources and limits of this example

Annual figures match the saved Expanded one-slot simulation and its separate held-window SPY source. Existing independent evidence verifies the saved arithmetic and proxy timing. Economic price-basis equivalence and synchronized tradable excess remain unproved. These idealized historical results are not live performance, expected returns or a complete execution model. The two strategies' SPY columns use different methods and should not be compared as if they were identical benchmarks.

04 / A deliberate workflow

From observation to understanding

Make room for
a better question.

01

Find the context.

Start with a seasonal window or an emerging price structure. Know which model you are looking at.

02

Study the evidence.

Read the history, matched benchmark and exceptions. Separate a developing setup from a qualified signal.

03

Understand the result.

Review the model's admission and exit context. Keep historical simulations distinct from current observations.

Inside the research

A real product walkthrough

Follow the question.
Keep the context.

Start with the scanner, open Continuation research, then examine Strategy Performance. Explore Surge through its own research view. These dated product screens show the path, with the evidence and its limits kept in view. The scanner disclosure is adapted for this public preview. Open any image to read it at full size.

01 / Find your research

Begin with a question.
Choose a research path.

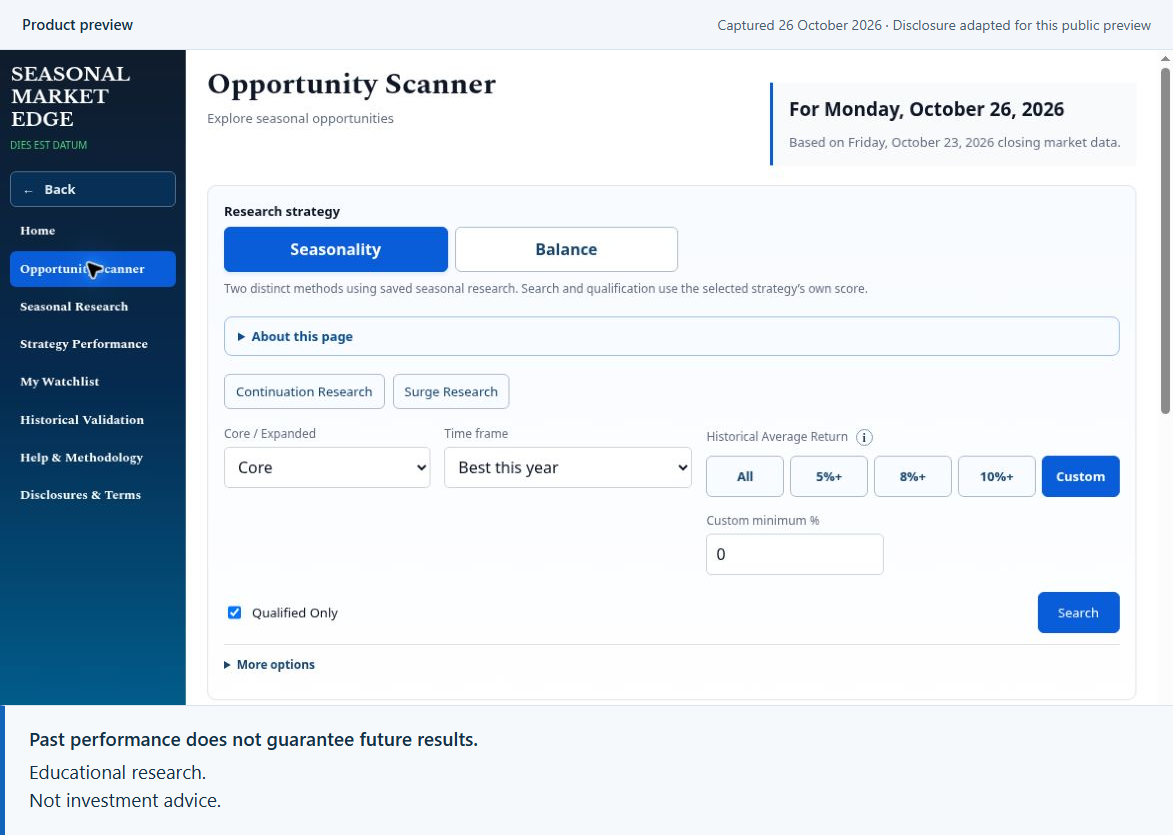
Use the Opportunity Scanner to explore seasonal windows, or follow its links into Continuation and Surge research. The strategies ask different questions; the navigation keeps each path clear.

Scanner search step — product preview based on a screen captured 26 October 2026, using 23 October closing data. Disclosure adapted for this public preview. Past performance does not guarantee future results. Educational research. Not investment advice.

Opportunity Scanner search controls with Continuation and Surge links; captured 26 October 2026, with disclosure adapted for this public product preview.Open the product preview ↗

02 / Examine Continuation

Watch the structure.
Wait for confirmation.

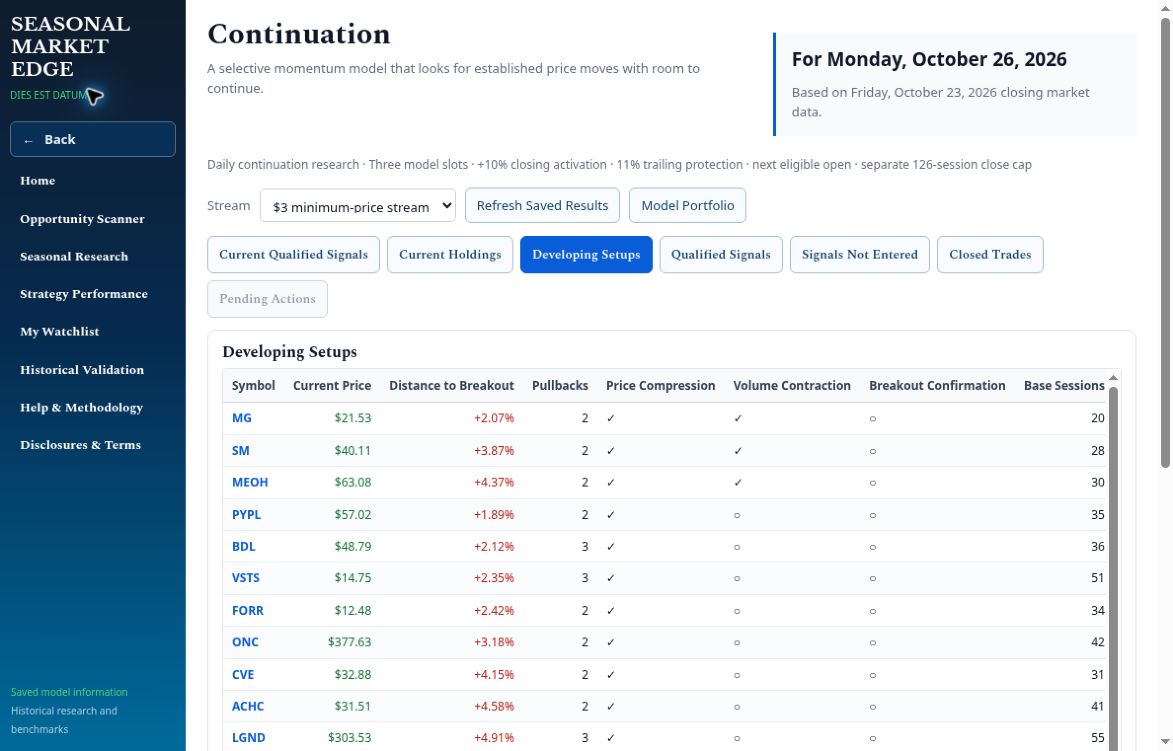
Continuation separates developing setups from qualified signals. Pullbacks, price compression and breakout confirmation help explain where an observation stands. A developing setup is not a confirmed signal or a portfolio entry.

Continuation Developing Setups · research for 26 October 2026, based on 23 October closing data.

Current Continuation developing setups showing research checkpoints, not qualified signals.Open the original screen ↗

03 / Review Strategy Performance

Read the record.
Keep its assumptions.

Compare the Continuation model with passive SPY, then explore the years, trades and scope behind the chart. Historical simulation and the current model period are identified separately.

Hypothetical model results, not actual account performance. Preserved 2016–2025 research; 2026 YTD through 23 October. Annual saved points, not a complete daily-equity archive. The historical three-slot model is not a retroactive test of the current minimum-price universe.

Continuation Strategy Performance chart identifying preserved 2016–2025 research, 2026 YTD, passive SPY and annual-point methodology.Open the original screen ↗

04 / Explore Surge

Confirmation matters.
So does waiting.

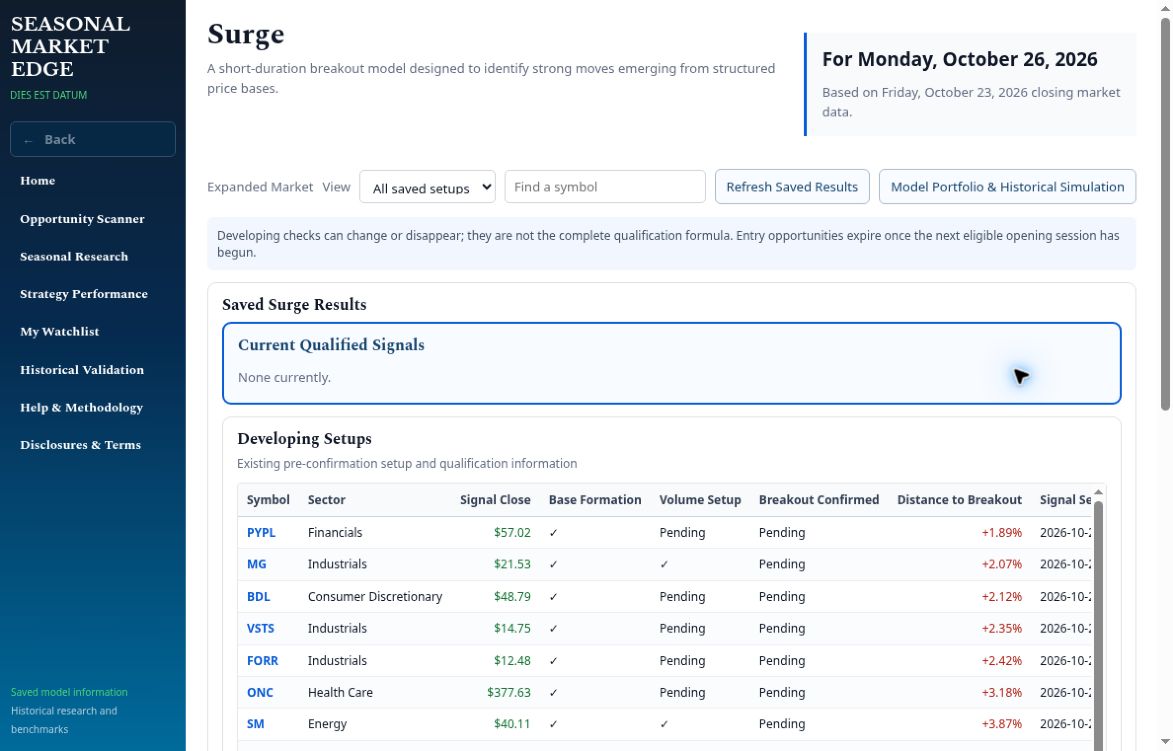
Surge examines strong moves emerging from structured price bases. Its separate view makes the distinction visible: developing setups can exist even when no current signal has qualified.

Surge research for 26 October 2026, based on 23 October closing data. This snapshot shows no current qualified signals.

Current Surge research with no qualified signals and a separate developing-setups table.Open the original screen ↗

These dated screens demonstrate product navigation, not an executed trade or a recommendation. The scanner preview uses the captured controls with a separately adapted disclosure panel. Financial data and the other research screenshots are unchanged.

05 / Four distinct strategies

Independent models. Separate results.

Different questions.
The same care.

01

Seasonality

A data-driven model that identifies historically strong seasonal windows in individual stocks.

↗
02

Balance

A blended seasonal model designed to balance opportunity and stability.

Seasonal blend
03

Continuation

A selective momentum model that looks for established price moves with room to continue.

↗
04

Surge

A short-duration breakout model designed to identify strong moves emerging from structured price bases.

↗

Each model follows its own admission, cash, position and exit rules. Their balances and results are never combined.

06 / About Seasonal Market Edge

Curiosity, shaped
by discipline.

Good research makes its reasoning visible.

Seasonal Market Edge brings seasonal and price-structure research into a considered view of the market: what has happened, what is developing, and what evidence has actually qualified.

We believe an explanation belongs beside a result. The benchmark, the losing periods and the model's assumptions should remain part of the story.

A public introduction, ahead of launch.

07 / A few useful distinctions

Before you
go further.

Is this available to use today?

This public homepage is a prelaunch preview. It introduces the research approach. Subscriptions, checkout, trials and the “2 for You” demo are not available from this page.

Is a developing setup a buy signal?

No. A developing setup can change or disappear. Qualification is a separate event, and qualification does not guarantee admission to a model portfolio.

Are historical simulations current results?

No. A historical simulation depends on a specified period and set of assumptions. It is not an actual account record and does not establish what will happen next. Current research and any future live results need their own dates and labels.

How should I use this research?

As educational information for your own study. It does not take account of your objectives or circumstances and is not a personalized recommendation. Investing involves risk, including loss of principal.

How are the performance examples sourced?

Continuation and Surge reproduce saved historical research, with all ten annual observations from 2016 through 2025. Their benchmark methods differ. Read the assumptions and limits beside each table; neither is current performance, an actual account record or proof of future returns.

Seasonal Market Edge is coming.

Hear the whisper. Be the first to know.

If this kind of research is useful, join the launch list: seasonalmarketedge.com

Join the list